Information Design/Final Project: Infographic Video Animation
Natalie Chu Jing Xuan, 0354589
Information Design, Bachelor of Design (Honours) in Creative Media
Module Information Booklet (MIB)
Final Project: Infographic Video Animation
Our group consists of 8 members:
- Yan Zhi Xuan (0369425) – Leader
- Sin Jun Ming (0364638)
- Natalie Chu Jing Xuan (0354589)
- Jie Xuan (0356515)
- Chan Xiang Lam (0358400)
- You Siyuan (0366978)
- Iman Mikudim (0338004)
- Esma Reza (0339055)
.jpg) |
| Fig.1 Instructions |
1. Proposal
During the first week, we explored 3 potential topics:
- How to make a chocolate cake? (Explaining a process)
- What is procrastination? (Defining a concept)
- What is a balanced diet? (Creating awareness)
This is our proposal slide that covers the definition, reasons for choosing this topic, the objectives, target audience, and key information for each topic.
After thoughtful discussion, we agreed on "What is a balanced diet?" as our project focus. This topic is particularly relevant as it promotes health awareness and encourages better eating habits.
2. Pre-Production
The pre-production phase is where we planned and designed the visual and structural elements of our animated infographic. This stage was crucial in ensuring that our final animation would be visually appealing, informative, and easy to understand.
During this phase, we focused on:
- Moodboard – Gathering inspiration for the overall look and feel.
- Typography & Colour Scheme
For the color scheme, we chose warm and natural colors like brown, orange, and yellow to give a friendly and healthy feel. Next, we used a bold and fun font called ‘Super Foods.’ It gives a fun and playful look while still easy to read.

|
| Fig.2.2.1 Colour Scheme |

|
| Fig.2.2.2 Typography chosen: Super Foods |
- Visual References
For visual references, we collected different food and nutrition infographics, including meal plate diagrams. These helped us design clear and engaging visuals for our animation.

|
| Fig.2.2 Visual References |
- Script
Before developing the wireframes, we created a structured script to outline the animation flow, key visuals, and voiceovers. This script served as a foundation for designing the scenes and ensuring a smooth narrative throughout the video.
- Wireframes & Sketches
As we already have our moodboard, we started with wireframes and sketches to map out our infographic animation. This helped us organize the visual elements and ensure a clear information flow.
The wireframe layouts for different scenes in our animation were created by Iman. These serve as the blueprint for our design. For example, we have a heptagon-shaped nutrition chart, an infographic on energy benefits, and a pie chart visualizing a balanced diet. These wireframes allowed us to refine our ideas before moving on to detailed illustrations and animation. After that, Yan Zhi Xuan move on to sketch out the initial visual of our animated infographic video.
|
|
| Fig.2.5.2 Sketches |
.png)
3. Production
With our visual direction, storyboard, and design elements finalized, we moved on to the production phase, where we translated our sketches and wireframes into finalized digital assets, animated them to create engaging visuals, and incorporated voiceovers for a more immersive experience.
Our production process included:
- AI Digitalization - Converting sketches into vector illustrations.
After finalizing our wireframes, we moved on to the design using Adobe Illustrator. The illustrations and scene layouts were created in Adobe Illustrator, ensuring a clean and visually appealing look while maintaining consistency with our theme.

|
| Fig.3.1 Adobe Illustration progress screenshot |
- AE Animation Work Progress - Animating the infographic using Adobe After Effects.
Once the illustrations were completed, me and Jun Ming animated the scenes in After Effects. They added movement, smooth transitions, and effects to make the infographic more engaging.
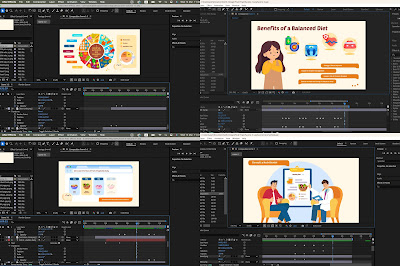
|
| Fig.3.2 After Effects progress screenshots |
- CapCut Editing & Voice Acting
Once our animation was ready, Jie Xuan and Xiang Lam moved on to voice acting and editing to complete the video. First, they recorded the voiceover following the script (Fig.2.4). This helped ensure the narration matched the visuals and flowed naturally. Then, for background music and sound effects, they sourced them from Douyin and YouTube. These elements make the animation more engaging and lively.

|
| Fig.3.3.1 Sound effects |
Finally, they edited everything together using CapCut. They aligned the voiceover, added sound effects, and fine-tuned the timing to make sure the animation was smooth and well-paced. With these final touches, our infographic animation was complete.

|
| Fig.3.3.2 CapCut Editing progress screenshots |
4. Post-Production
After completing the animation and editing, we moved into the post-production phase to finalize our project by making refinements, ensuring smooth transitions, and preparing the final output. At this stage, we also reviewed the entire animation to identify any areas for improvement before submitting the final version.
- Consultation, Feedbacks & Refinements
We gathered feedback from Mr. Fauzi to refine our animation. In Week 6, Mr. Fauzi pointed out a spelling error in "Protein", suggested speeding up the essential nutrients chart, and recommended adding numbering and enlarging text in Scene 4. He also noted that the ending felt abrupt, so we adjusted it for a smoother finish.
By Week 7, additional refinements were made based on their input. The transition from Scene 3 to Scene 4 had an unintended blank screen, which we shortened. We removed a pen element in Scene 4-1, added more animation in Scene 4-2, and adjusted the voiceover to sync with the visuals. These improvements made the final animation more polished, engaging, and seamless.

|
| Fig.4 Refinements |
- Final Presentation
Final Outcome
Here's our final outcome: https://youtu.be/Ts8rP2h9fvo
Feedbacks
Throughout the project, we received valuable feedback from our lecturer, Mr. Fauzi, which helped us refine our animated infographic. Below is a summary of the key feedback and improvements made:
Week 3 - Initial Approval
- Feedback: Wireframes were well-structured and clear.
- Action Taken: Proceeded with production based on approved wireframes.
Week 6 - Content & Timing Adjustments
- Spelling Error: The word "Protein" was misspelled throughout the video.
- Scene 1-2: The essential nutrients chart needed a slightly faster transition.
-
Scene 4:
- Added numbering for better organization.
- Increased text size for better readability.
- Ending: The animation stopped too abruptly, requiring a smoother transition.
Week 7 – Final Refinements
- Scene 3 to Scene 4: The transition was not smooth. A blank screen appeared for a moment. This part was shortened.
- Scene 4-1: Removed the unnecessary pen element.
- Scene 4-2: Added more animation to enhance engagement.
- Voiceover Syncing: The narration was misaligned with the visuals, so adjustments were made to ensure proper synchronization.
Reflection
Working on this project has been a valuable learning experience, allowing us to explore the entire process of creating an animated infographic from start to finish. From researching and planning to designing, animating, and refining based on feedback, each stage required teamwork, problem-solving, and adaptability.
One of the biggest challenges was ensuring a smooth animation flow while maintaining clarity and engagement. Through consultations with our lecturers, we identified areas for improvement, such as timing adjustments, visual enhancements, and voiceover synchronization. These revisions strengthened our final outcome, making it more polished and effective.
Additionally, collaborating as a team helped us develop better communication and task management skills. Each member played a crucial role in bringing the project to life, and our combined efforts resulted in a well-structured and visually appealing animation. Overall, this experience has deepened our understanding of design principles, animation techniques, and the importance of iteration in the creative process.


Comments
Post a Comment